How to debug Angular 2 with WebStorm


WebStorm is my favorite choice when it comes to develop web applications especially with Angular 2. Most of the time I have a fullscreen WebStorm on my primary and Chrome on my secondary screen. When it comes to debugging, I spin up my Chrome Developer Tools and debug along. But sometimes there are cases, where I want to use WebStorm for debugging. Most of the time, all necessary files are already open in my IDE, since I'm currently working on them. I've got a "debug stack" in my head which is visually presented by all open files in WebStorm making it much more easy to jump around in the source code.
Prerequirements
To start using WebStorm as your debugger, you need to install a Chrome extension called JetBrains IDE Support. After installing, you get a fancy new icon within Chrome.
![]()
Right click it and click Options. Alternatively go to chrome://extensions, scroll to JetBrains IDE Support and click Options there. A new page will open, showing you Host and Port. Especially the port should be noted (which defaults to 63342).
A left click on the fancy JetBrains icon will switch to your IDE, if it is open.
WebStorm settings
Now switch to your beloved WebStorm and open the project you want to debug. Since we want to debug Angular 2, which uses TypeScript, we need to create source maps, too. So if the build process of your web app does not create source maps yet, you need to do this first.
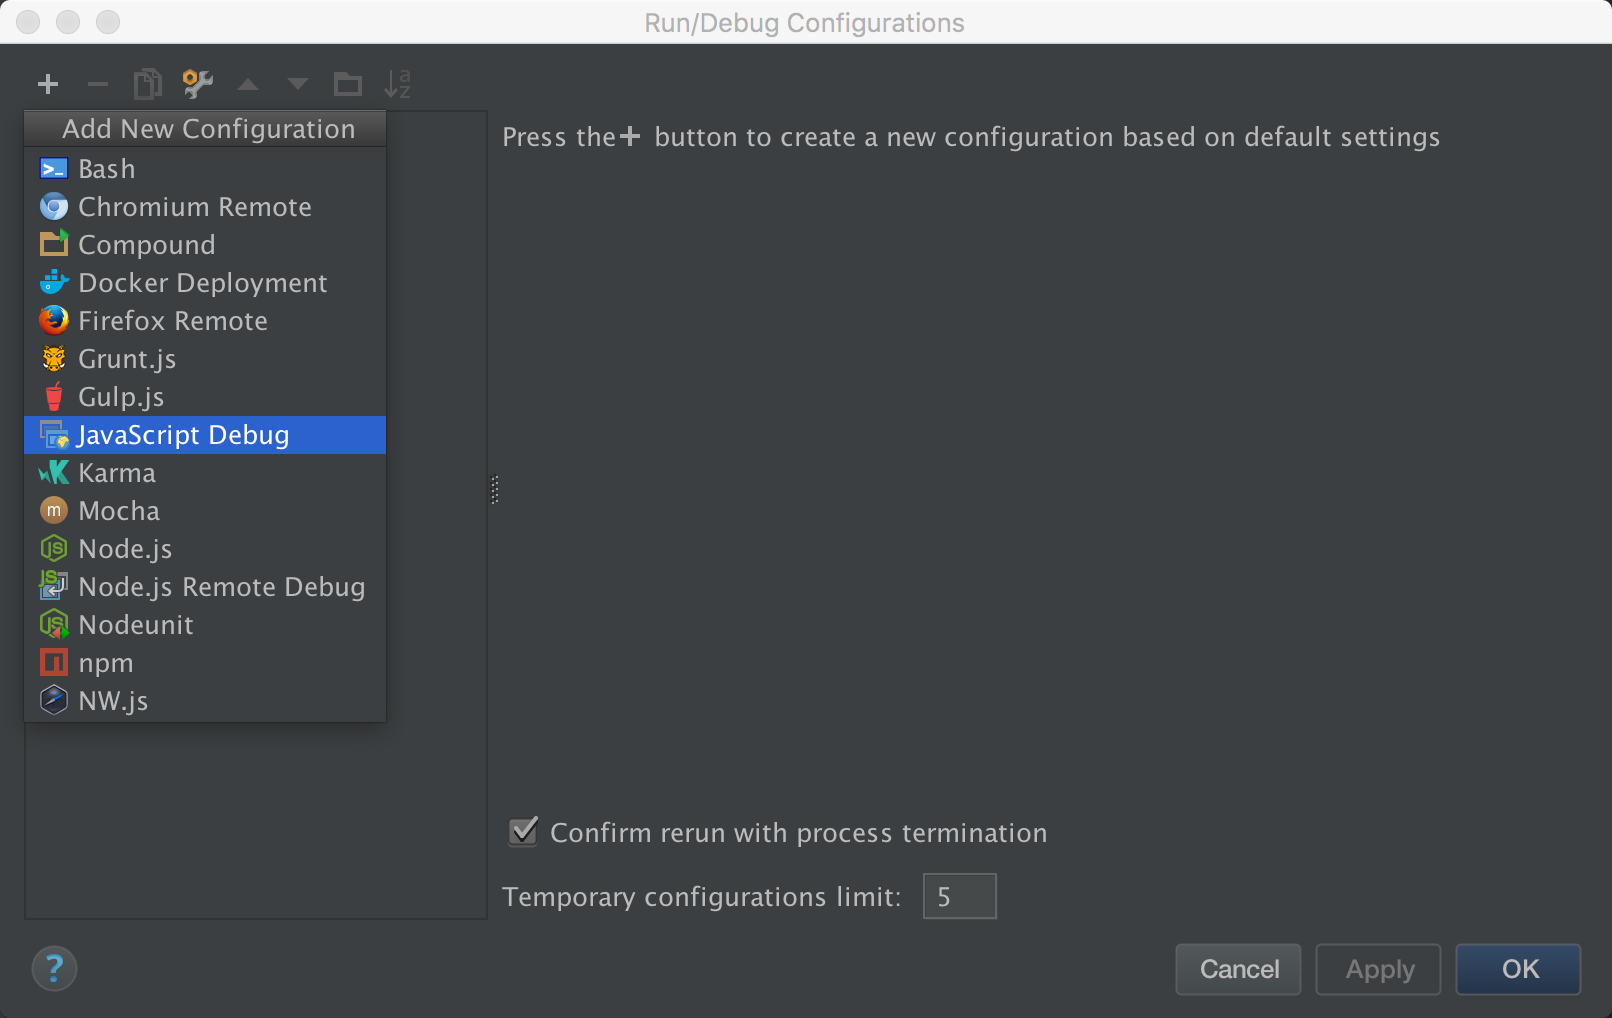
For this demo I'm using the BoardZ! Cross Platform Sample Application which fortunately already creates source maps. Within WebStorm, go to Run -> Edit configurations... A new dialog will open, where you click on the little plus icon at the top left and select JavaScript Debug.
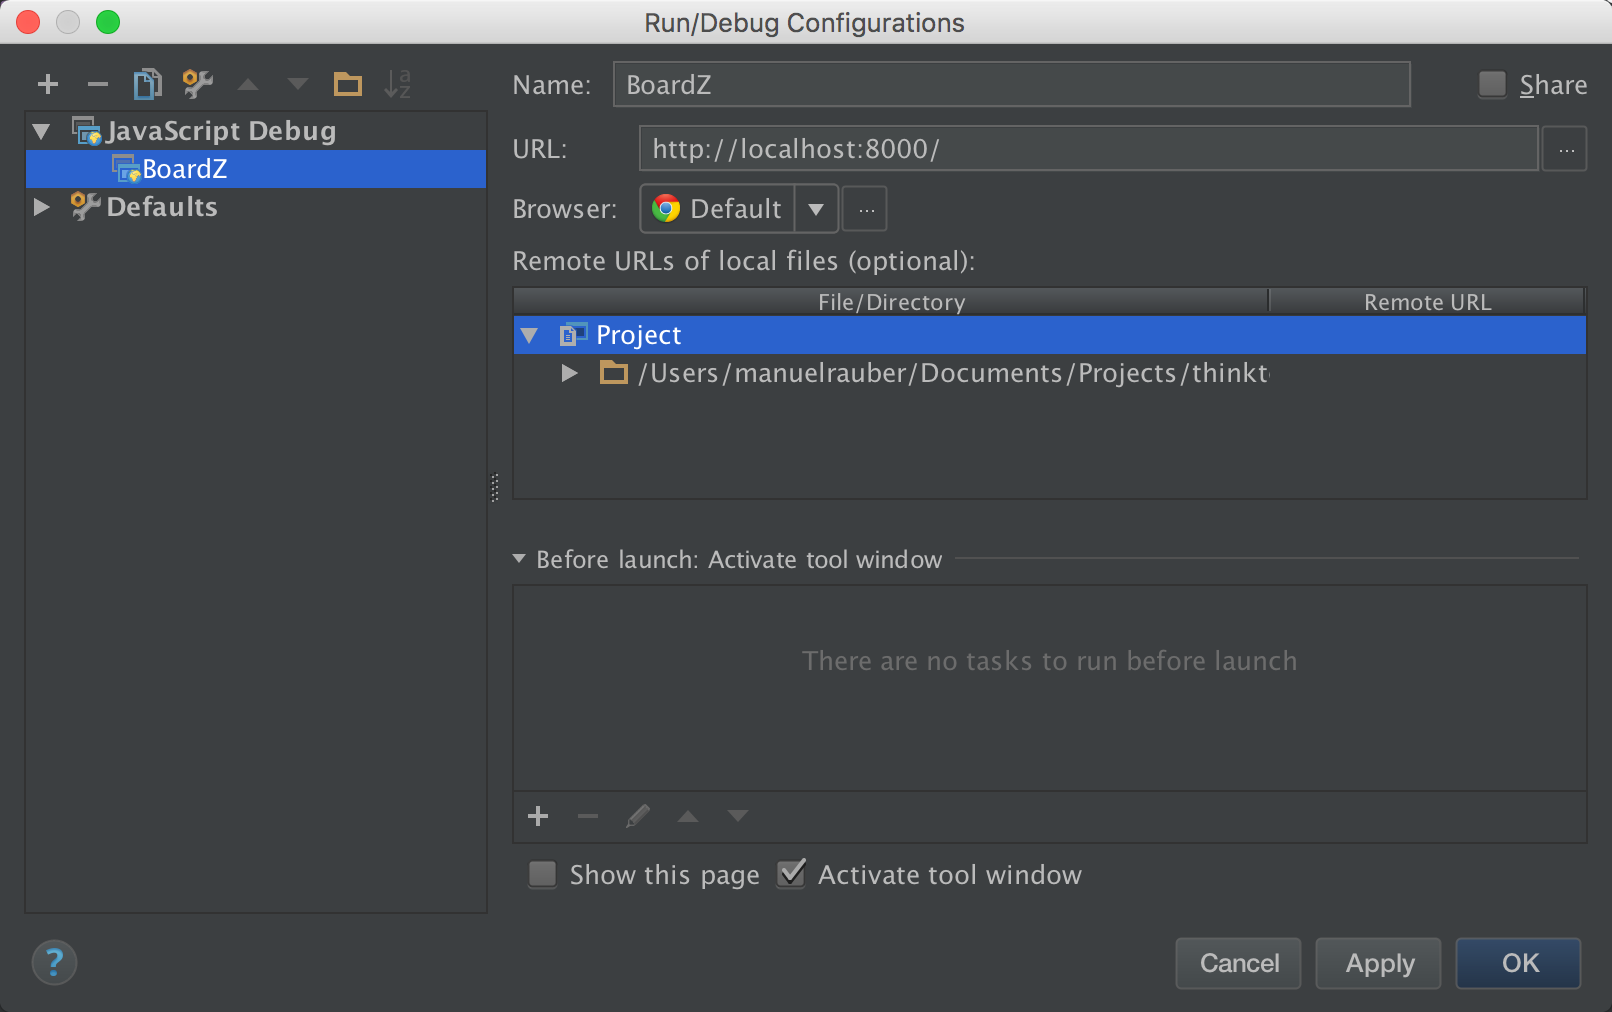
At next you need to set some settings on the newly opened right side. Choose whatever name you like. In my case it's BoardZ. In URL you put in the URL where you web application is hosted. Per default, BoardZ! is hosted on http://localhost:8000/, so I put http://localhost:8000/ into the URL field. If everything is running smoothly, as it should, WebStorm automatically populates the list of Remote URLs of local files. There should now be an entry pointing to your project.
Now click OK. Start all the scripts you need to run your web application. For BoardZ that's a simple npm run watch. If done, click on that little Bug icon in WebStorm (and be sure, that the correct configuration is selected). WebStorm will now attach itself to the installed Chrome extension (or opens a browser at first, if it is not open yet). If WebStorm complains that it cannot find a running JetBrains IDE Support then the port it tries to reach is wrong. WebStorm will tell you which port it uses for the connection to the extension. You need to go to the extension and change the port to whatever WebStorm wants.
![]()
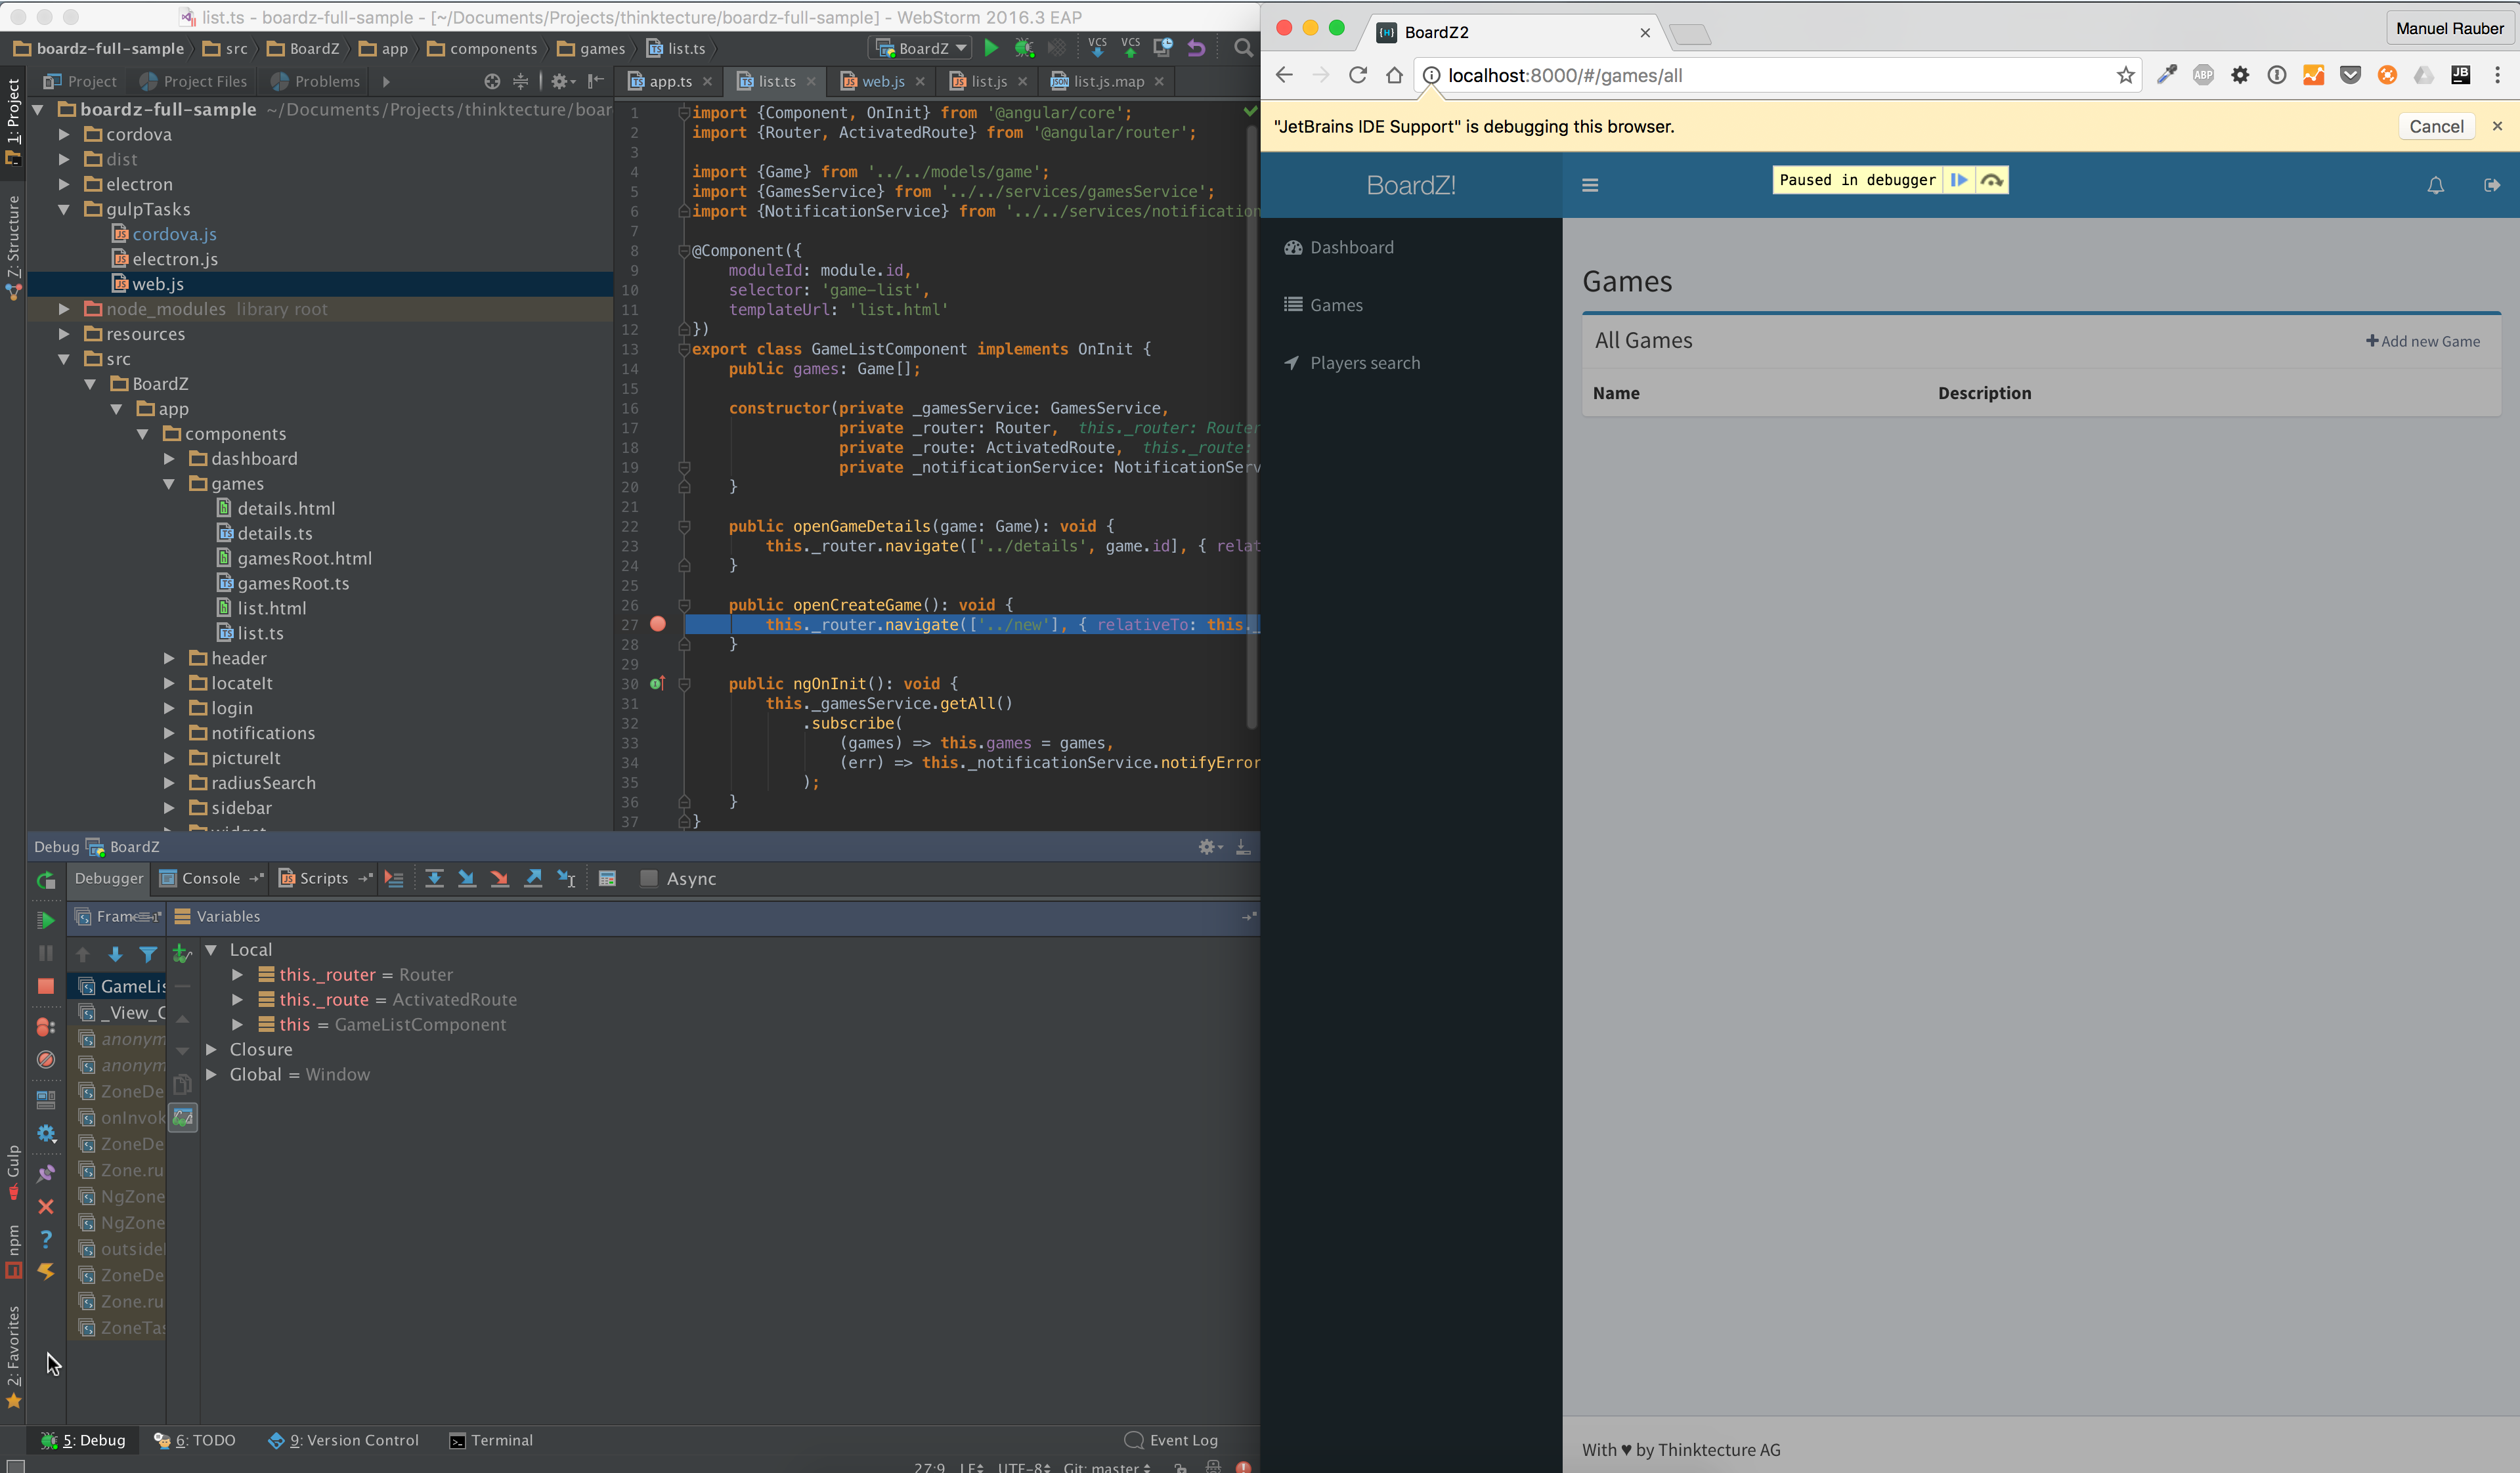
If everything works, Chrome shows a little note at the top of the page, that JetBrains IDE Support is debugging this browser. You can now add a breakpoint in your TypeScript files and start debugging! Cool, eh? ;-)
In case your WebStorm/Chrome does not stop at your set breakpoint, your source root of your source maps points to the wrong folder. If you use gulp-sourcemaps you can use the sourceRoot attribute to set the correct folder, like we did in BoardZ.
This approach is not only working for Angular 2, but for other JavaScript applications, too. Happy debugging!